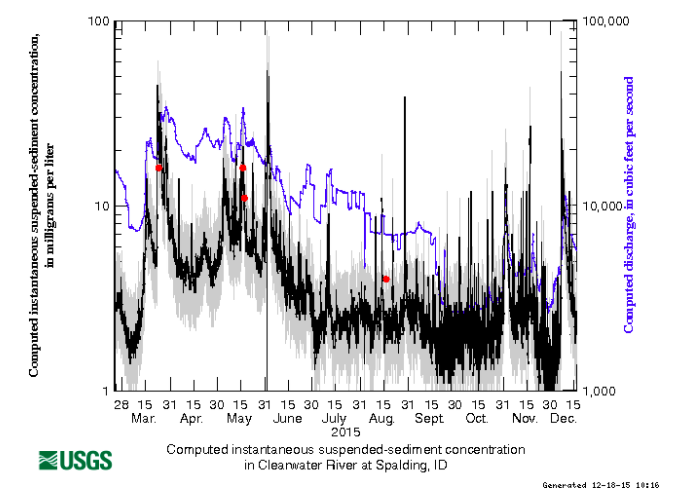
Cool Graph of the Clearwater
Most of you know that the Clearwater basin experienced major fires this past summer, mainly in late August.
This is a really fascinating graph that shows the amount of sediment in the river (black line) in relation to the water volume (Blue Line).
You can see how the amount of sediment increased dramatically in September/October, corresponding with the first heavy rains of fall after the fires.
So what does this mean for the fishing?
The river has been carrying a stronger tea stain following major rain events, sediment can be seen built up in soft water close to shore. That being said, we still have plenty of clarity to fish and the valley seems to be recovering quickly.
By November, green grass could be seen sprouting quickly on the burnt hillsides. The Clearwater valley actually greens up in the winter and the grass grows more now than any other time during the year. This should be great for stabilizing burnt hillsides.
I fully expect the sediment to clear quickly this winter and things to be pretty normal by the next fall season.
We are getting lots of rain and snow over the past few weeks which is a vast improvement on last year's drought, hopefully it continues!

